In the mid-19th century, Peruvian fishermen observed changes in ocean currents and increased sea surface temperatures approximately every four years around Christmas. Associating this with the Christian tradition of the birth of the “child” Jesus, they named it “El Niño” (child in Spanish). This phenomenon had a second phase, cooling, which was named “La Niña.” El Niño and La Niña have attracted the interest of meteorologists and climatologists, who have been gathering evidence of their significant influence on global climate.
Everything is Interconnected
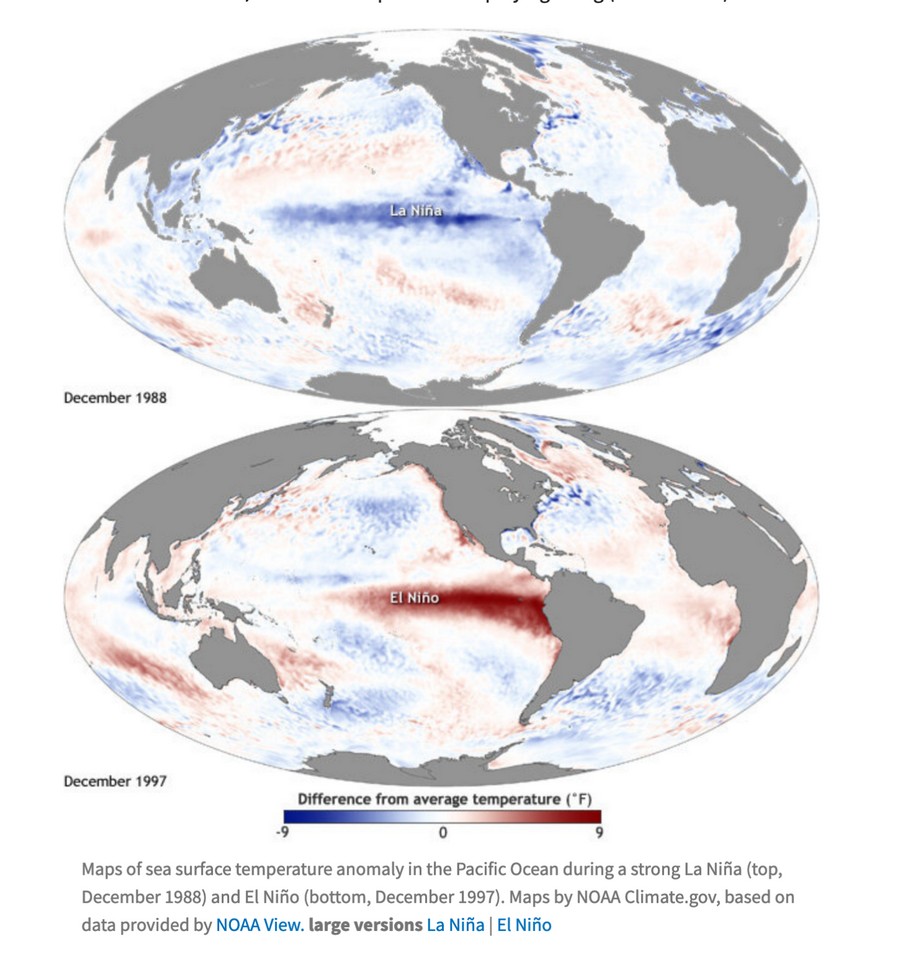
This map clearly shows the temperature differences in the tropical Pacific waters that characterize El Niño and La Niña.

Maps of sea surface temperature anomalies in the Pacific Ocean during two particularly strong events: La Niña (December 1988) and El Niño (December 1997). © NOAA Climate.gov, based on data provided by NOAA View.
In 1969, the study of El Niño led meteorologist Jacob Bjerknes to link the warming of the ocean currents with the phenomenon known as the Southern Oscillation. This oscillation involves increased atmospheric pressure in the western Pacific and the subsequent weakening of the easterly trade winds. Since then, these phenomena have been collectively referred to as the El Niño-Southern Oscillation (ENSO).
ENSO has become a key area of study in climatology, especially since the 1970s when Edward Lorenz’s numerical models began to be applied. The American mathematician and meteorologist demonstrated that all meteorological phenomena are interconnected and that small perturbations in the atmosphere can lead to significant global climate changes through the complex atmospheric and oceanic circulation systems. The famous phrase “the flap of a butterfly’s wings in Brazil can set off a tornado in Texas” illustrates this concept.
One of the most relevant conclusions about the influence of ENSO on global climate is found in a study by Washington State University, published in Nature Climate Change, which shows its correlation with simultaneous drought events. After analyzing historical data, it was concluded that 68% of these droughts occur during El Niño or La Niña and that with continued atmospheric warming, the combination of ENSO episodes with simultaneous droughts will increase by 22%.
What Impacts Have Been Confirmed?
After decades of study, the impacts of ENSO on global climate have been well-documented. These effects are more evident in tropical belt regions, particularly concerning their influence on droughts and floods, which typically manifest inversely depending on whether it is El Niño or La Niña.
Here’s a summary of the impacts based on the most damaging phenomena:
Droughts:
- El Niño exacerbates drought conditions in the Horn of Africa and Southern Africa. At the same time, La Niña generally leads to wetter conditions, which can relieve these regions, some of the hardest hit by global warming.
- La Niña increases the risk of droughts in the central and eastern Pacific regions.
Floods:
- El Niño raises the risk of flooding in the central and eastern Pacific (Peru and Ecuador), Southeast Asia, Australia, the southern United States, and the Río de la Plata (Argentina and Uruguay).
- La Niña tends to increase precipitation and the risk of flooding in northeastern Brazil, Southeast Asia, and northern Australia, as well as in Colombia’s Andean and Pacific regions.

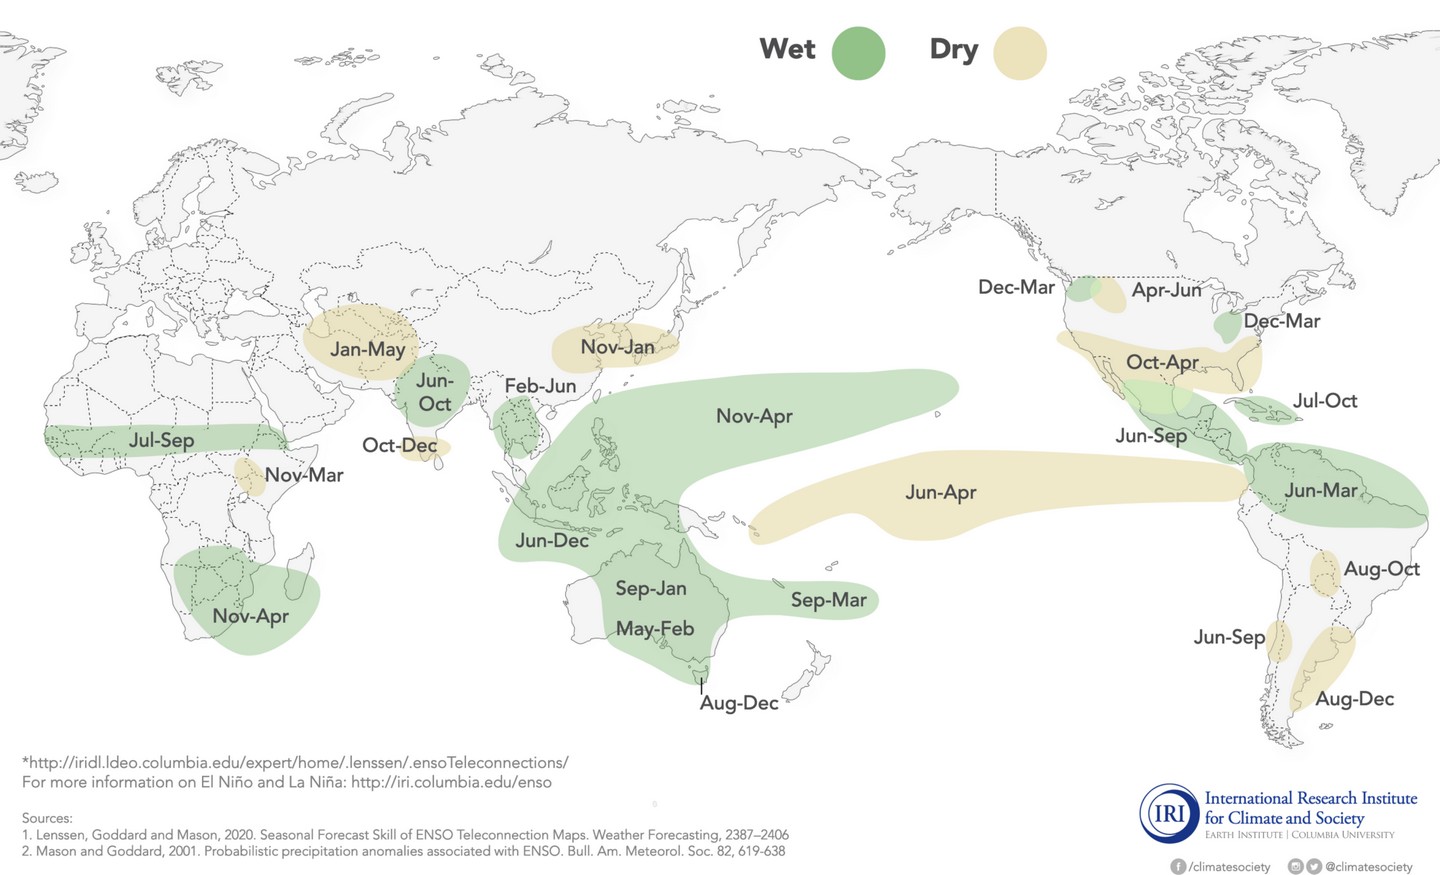
La Niña alters rainfall patterns in many parts of the world. The regions and seasons shown indicate typical impacts but are not guaranteed. © International Research Institute for Climate and Society
The effects are less pronounced in Europe: summers tend to be cooler during La Niña in the north and warmer and drier during El Niño, particularly in southern Europe and the Mediterranean.
The Neutral Transition Phase
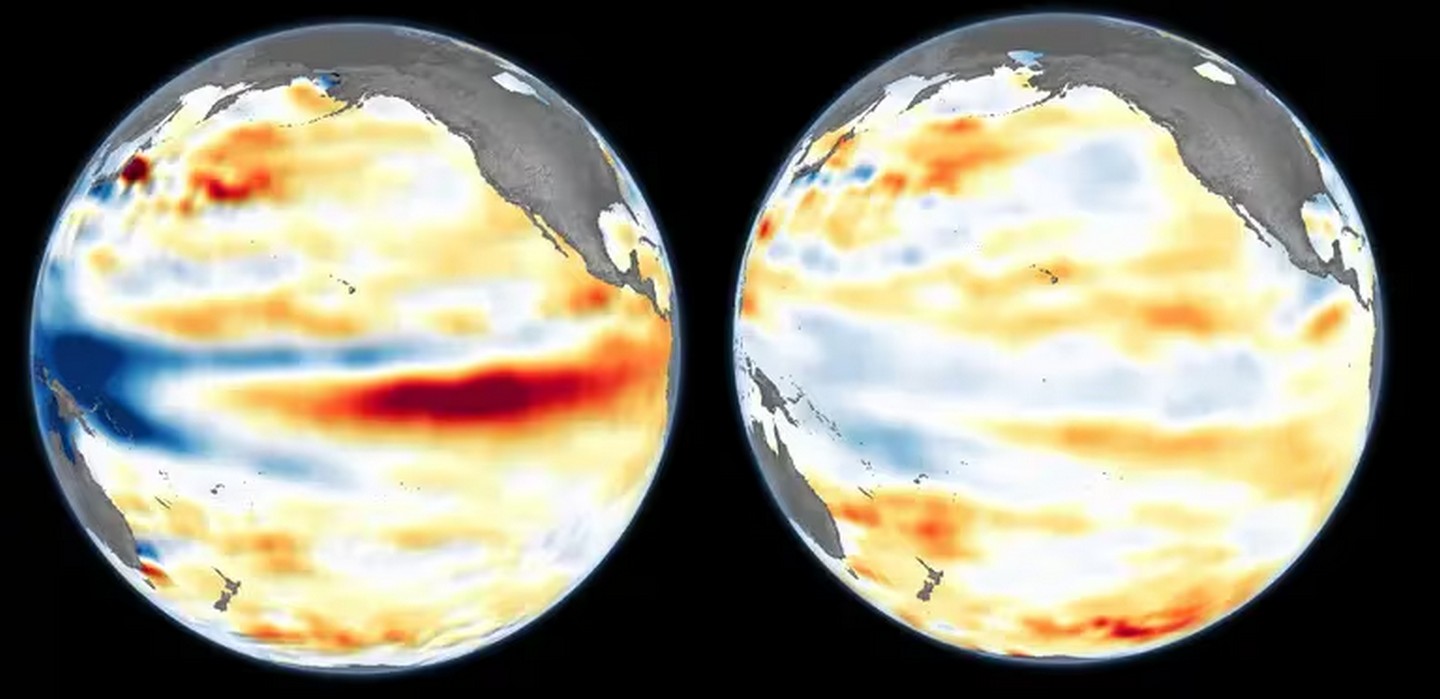
Last July, it was clear that El Niño had ended, but La Niña had not yet manifested. Climatologists expect that between September and October, the waters of the Pacific will start to cool noticeably. The following map shows that in July, the cooling had not yet occurred, and the ocean was in a neutral phase, transitioning between the two phenomena.

Comparison of Pacific Ocean temperature between December 2023 (left), with El Niño clearly evident, and July 2024 (right), where surface water cooling is observed but La Niña has not yet fully developed: this is the so-called transition phase. © NOAA Climate.gov, based on data provided by NOAA View.
Scientists and governments closely monitor this transition, which is crucial for climate forecasting, especially for regions heavily impacted by climate change. For example, during the last El Niño episode, forecasts allowed African governments to take measures that significantly mitigated the impacts.
In recent years, forecasting capabilities have improved considerably. Although there is still much progress to be made, the current levels of accuracy are due to remarkable advancements in detection technologies. On this page of the Climate Change Institute, you can access daily records of Earth’s water temperature and track its evolution through an interactive graph with data collected from satellites, Argo buoys (one of which we launched in the South Atlantic during the Barcelona World Race), and ship sensors.
As the public’s awareness of weather alerts continues to grow, so does their role in climate change awareness and preparedness. The global concern about climate issues, fueled by the phenomena of El Niño and La Niña, is helping to disseminate basic scientific concepts about Earth’s water cycle. This increasing interest and understanding among the public is not just encouraging, but also essential. Greater awareness and preparedness are key in addressing the challenges of climate change and building resilience.


